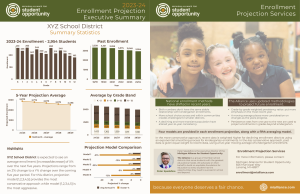
National enrollment methods have shifted in recent years. They no longer rely on birth data and cohort survival as adequate projection methods, due to several factors.
- Birth numbers do not have the same stable relationship with kindergarten enrollments.
- More school choice across and within communities creates challenges for smaller districts.
- A declining and more transient population has altered year-to-year consistency.
As a result, The Alliance engaged the services of a data and statistical analyst to refresh our enrollment projection program to align with the most up-to-date methodology.
The updated model is different from the previous in a few key ways:
- Kindergarten enrollments will no longer be determined by county birth rates, as the relationship between births and kindergarten enrollments is only relevant in very stable communities, of which there are few. Instead, our updated methodologies rely on recent enrollment trends and a smoothed growth model for kindergarten.
- Using a moving average across years places more consideration on changes as the years progress. This is important for kindergarten because it is often the kick-starter for each subsequent grade.
- An exponential smoothing model for kindergarten enrollments that places more emphasis on recent years is important for declining or growth districts because the most recent years are considered more important for weighting.
- Persistence rates from one year to the next are used to project enrollments in grades over K and adjust depending on the model.
New methodology for the Alliance’s enrollment projections will include consideration of the following:
- An exponential smoothing projection for kindergarten (and Pre-K, if requested) enrollments as the most conservative approach for declining enrollment districts because recent data is weighted higher.
- A five-year moving average kindergarten enrollment level is the more aggressive approach for declining enrollment districts because past data is given equal weight to recent data.
- A grade-by-grade weighted persistency ratio puts more emphasis on the most recent year.
- A two-year average persistency rate for each grade.
- Combined methods using each kindergarten projection and each grade level progression method.
The Alliance is an approved service provider for the Michigan Department of Treasury School Bond Qualification and Loan program.
Enrollment Projection Services Prices
In State: $500
Outside of Michigan: $1,000
Expedited Service (within two business days): $250
Executive Summary included with all reports
If you need to tweak any of the data once your report is completed, there is a $100 charge to rerun the report and summary.
Process
Complete a 2024-25 request form (after fall count day) and return it to enrollment@mialliance.com. Reports are completed in the order they are received, usually within one to two weeks.
Upon completion, you’ll receive a PDF of your report, invoice, interpretation guide and free Executive Summary.
Questions?
The Michigan Alliance for Student Opportunity (formerly the Middle Cities Education Association) is a group of member school districts that serve students with the greatest educational needs. We advocate on their behalf to build an equitable foundation for education so every student has the opportunities they need to succeed in school and beyond.
CONTACT INFO
Patricia Alderman
Member Services Coordinator
120 N. Washington Square, Suite 910
Lansing, MI 48933
enrollment@mialliance.com
517-492-1380